Visualizations Word2Vec on Swedish Parliament Speeches Can we find biases in political speeches with word2vec?
Visualizations Sweden: Crime vs Fear Crime vs Fear of Crime for Sweden (Data from 2016 crime surveys)
Visualizations Wikipedia Clickstream Visualization The Wikimedia Foundation has recently released Clickstream data.[1] This is the data that shows the "clicking around randomly" effect we're all familiar with when browsing Wikipedia.[2] I tried to do some initial clustering analysis on it, but thought, for the time being, it might be more
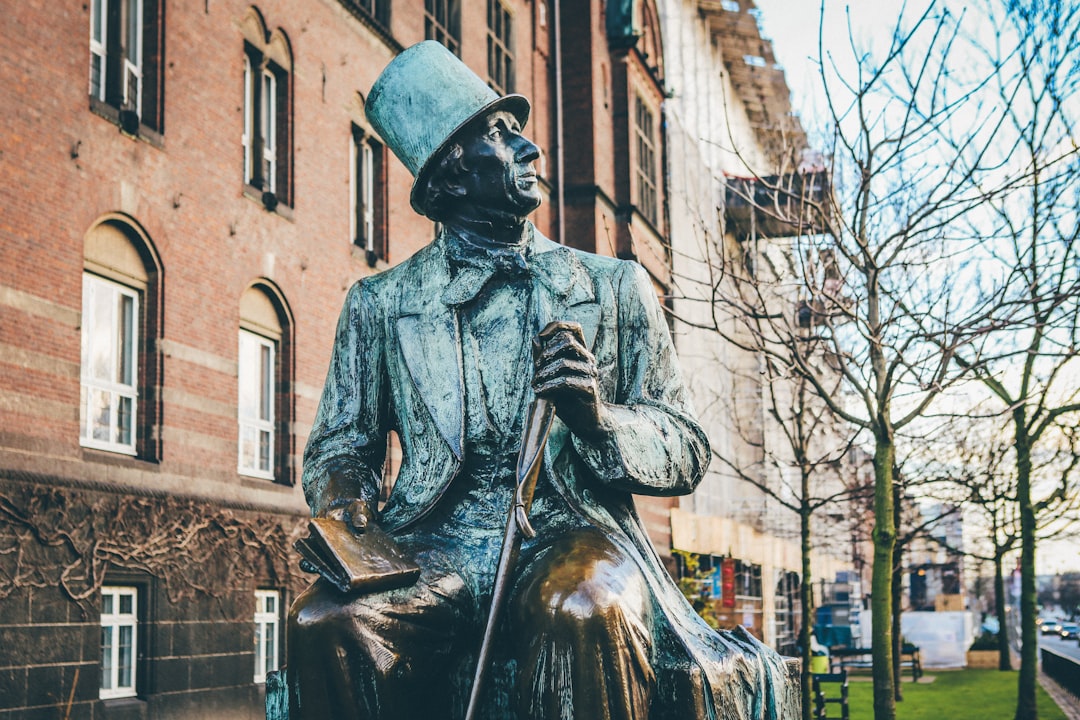
Visualizations Changes in Danish Political Parties from 2009 to 2011 Open in new window --- Political Support as Percentages There have been plenty of maps showing the outcome of the Danish 2015 election, though I don't know of any (so far) that look at percentage changes. I thought it would be interesting to take the percentage of votes each party
Visualizations Sweden Population Visualization Open in new window --- Sorry about the painful navigation above. I wasn't sure what the best way to embed it would be. How to read this This shows the population change in Sweden from 1749 to (as of this writing) 2015 according to Statistika Centralbyrån. There are 3 different